Data is currently at
https://data.giss.nasa.gov/gistemp/tabledata_v4/GLB.Ts+dSST.csv
or
https://data.giss.nasa.gov/gistemp/tabledata_v4/GLB.Ts+dSST.txt
(or such updated location for this Gistemp v4 LOTI data)
January 2024 might show as 124 in hundredths of a degree C, this is +1.24C above the 1951-1980 base period. If it shows as 1.22 then it is in degrees i.e. 1.22C. Same logic/interpretation as this will be applied.
If the version or base period changes then I will consult with traders over what is best way for any such change to have least effect on betting positions or consider N/A if it is unclear what the sensible least effect resolution should be.
Numbers expected to be displayed to hundredth of a degree. The extra digit used here is to ensure understanding that +1.20C resolves to an exceed 1.195C option.
Resolves per first update seen by me or posted as long, as there is no reason to think data shown is significantly in error. If there is reason to think there may be an error then resolution will be delayed at least 24 hours. Minor later update should not cause a need to re-resolve.
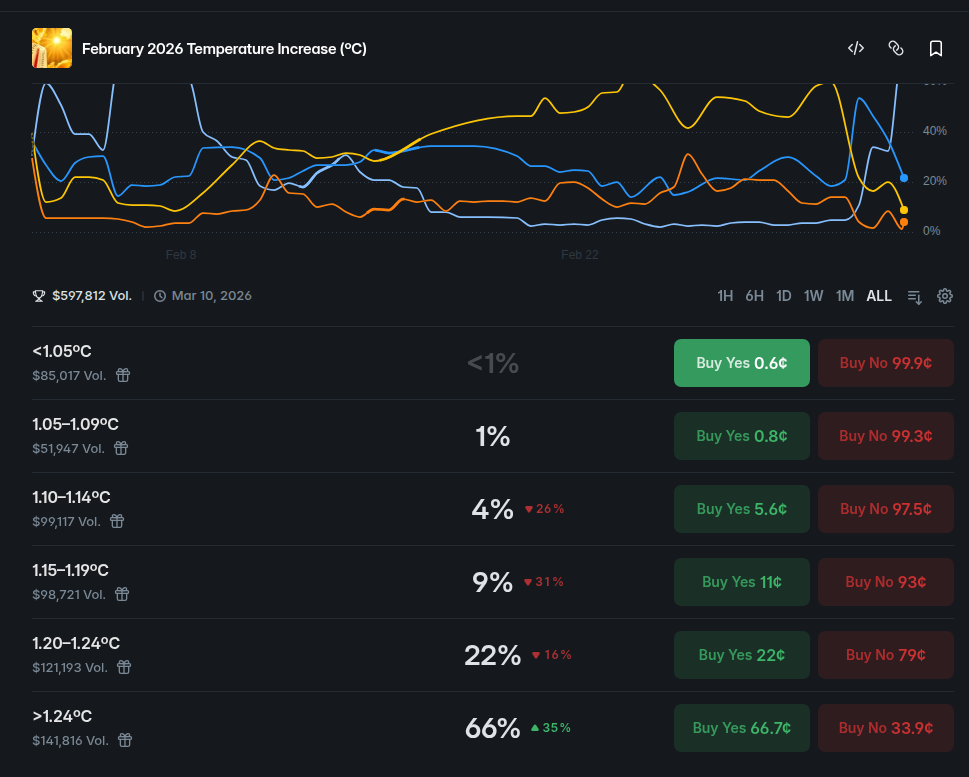
March 2026 market
 1,000
1,000People are also trading
GISTEMP Results (Feb 2026)
03/03 - 1.254
@chaitea I get a slightly different value (124.28), but more importantly it's too early and also NW Russia looks completely implausible -- this doesn't look like something homogenization is going to fix and it looks more like a data error. Just throw out this run.
Same problem with new ghcnm

One of the stations (Petrun) that was anomalously high did flip, compare the prior ghcnm to last night's ghcnm (a -19 C difference):
RSM000233242026TAVG-2120 P -545 P-9999 -9999 -9999 -9999 -9999 -9999 -9999 -9999 -9999 -9999
RSM000233242026TAVG-2120 P-2425 P-9999 -9999 -9999 -9999 -9999 -9999 -9999 -9999 -9999 -9999
This doesn't seem to even be explainable by partial data for the month (I have partial monthly means that go from Feb1-Feb 9 for instance to Feb1 - 26 from ERA5 and that region should have a cold anomaly) ...
Again, same problem with new ghcnm.
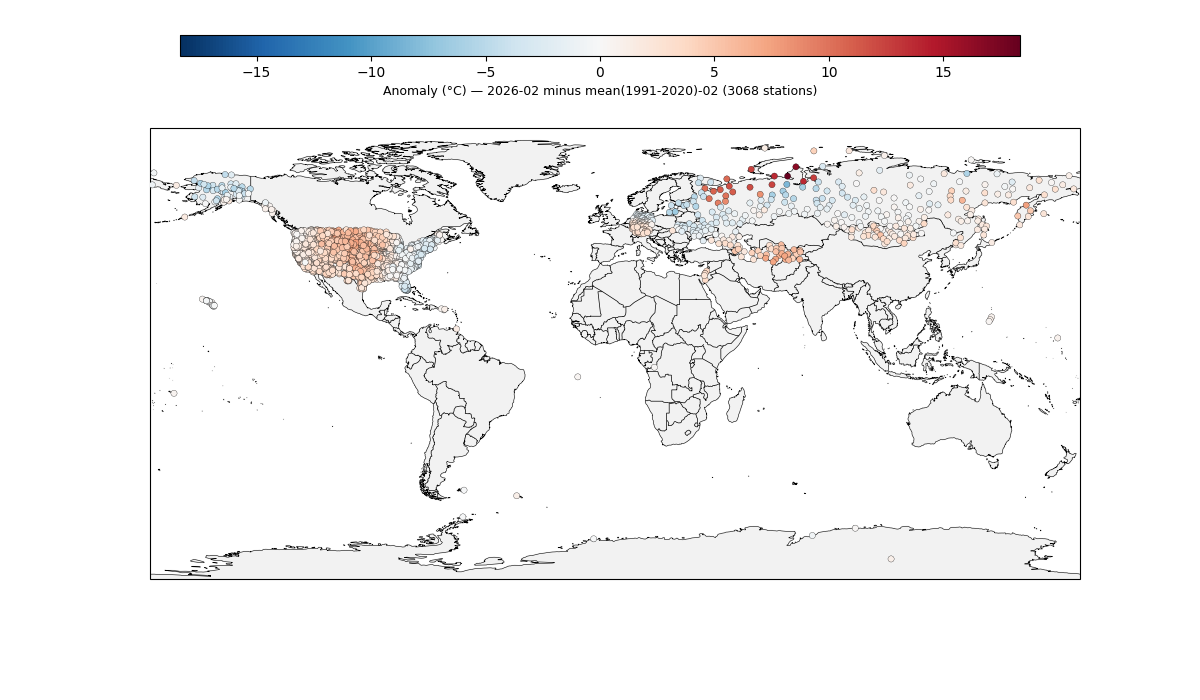
Given now we have most of the warmest warm anomalies now that the Sahel data has come in (excluding pieces of China/India), I reran the data from last night omitting the 19 NW Russian stations that are obviously erroneous. This leaves us though with a skewed dataset and roughly 40% or so of the data missing still:
This produces a gistemp for February of: 124.29
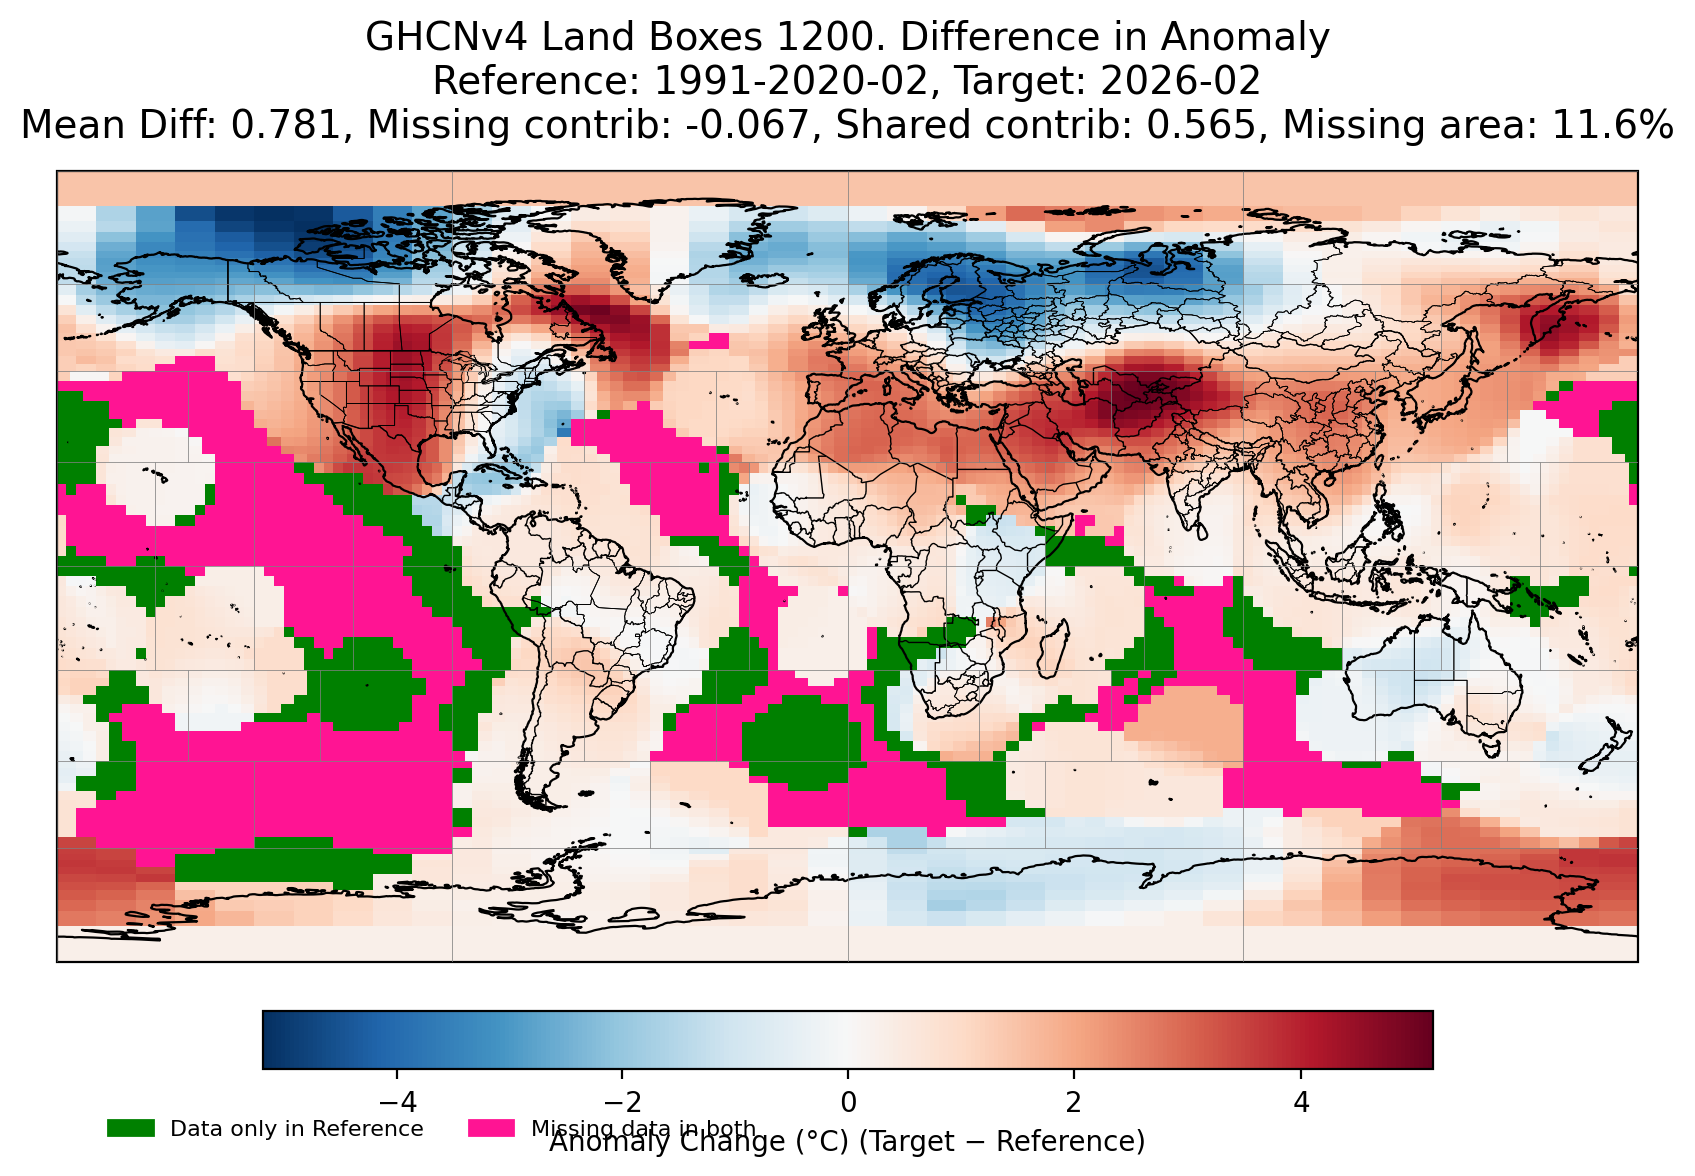
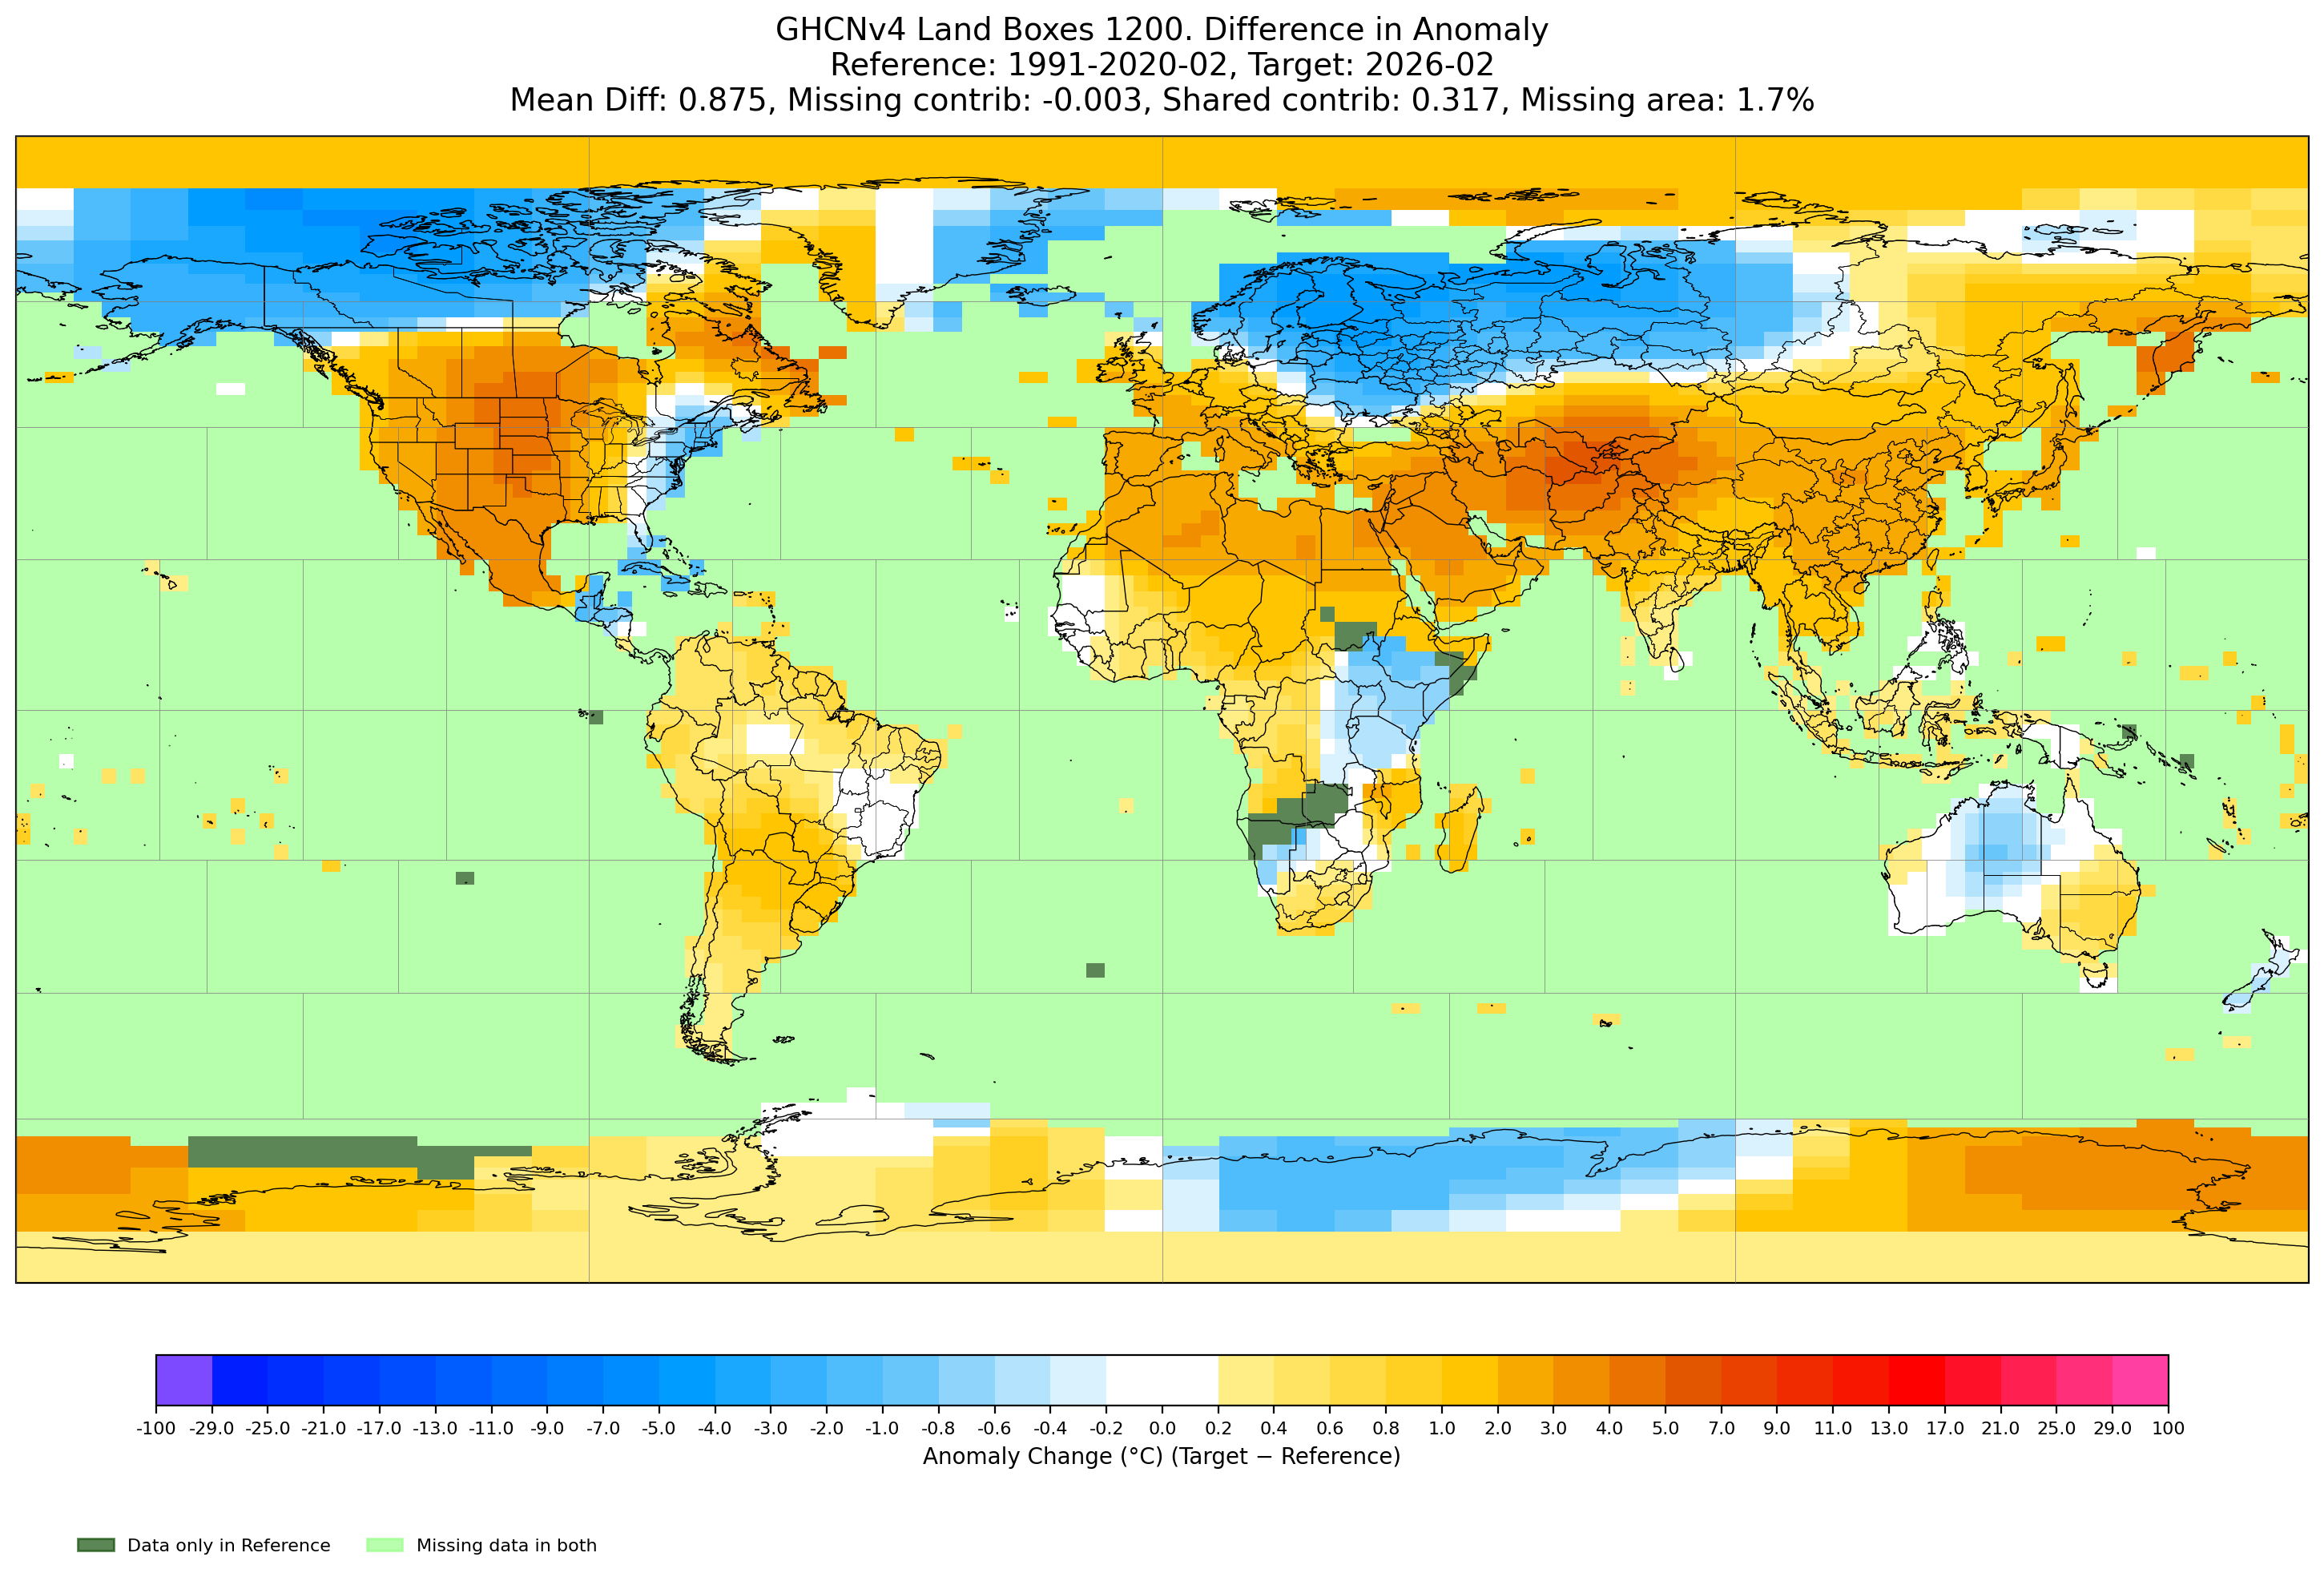
I've modified the below chart that you might be familiar with to properly show the anomaly as normal in the 1991-2020 dataset with it being Target-Reference now (so blue is cold anomaly in 2026):
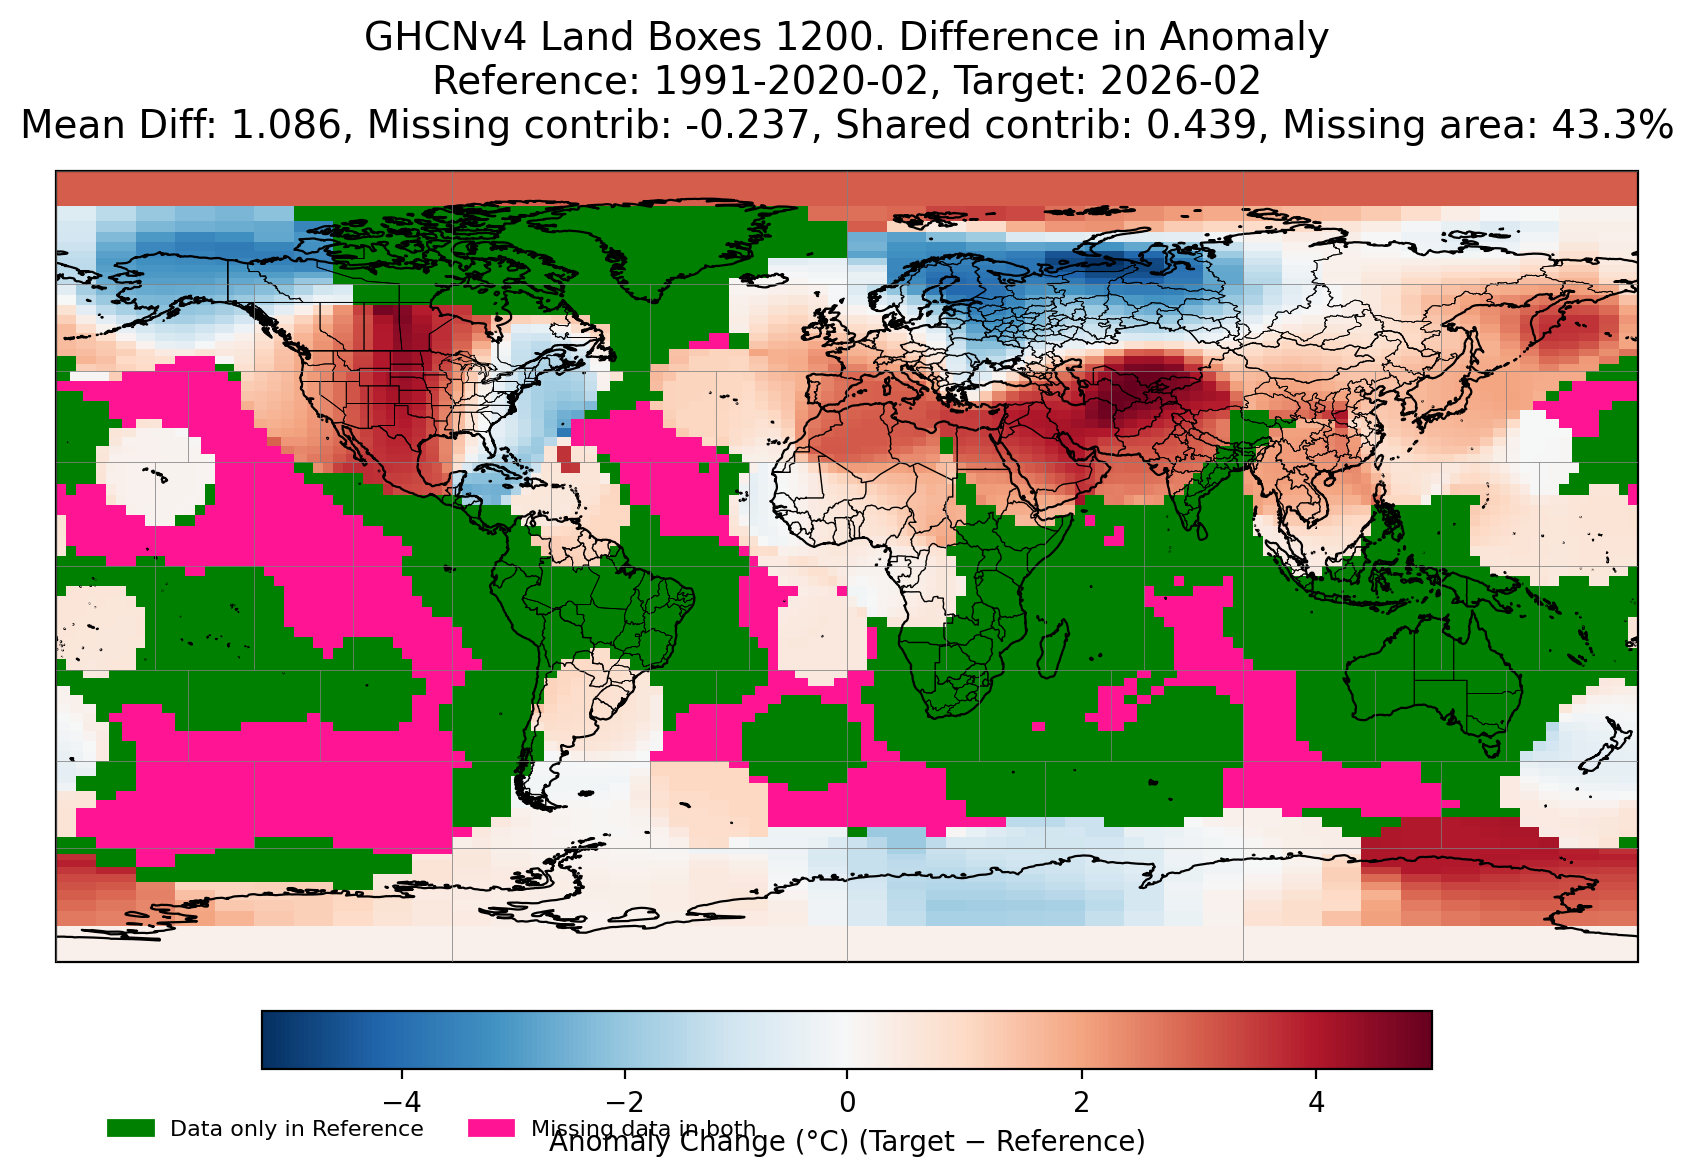
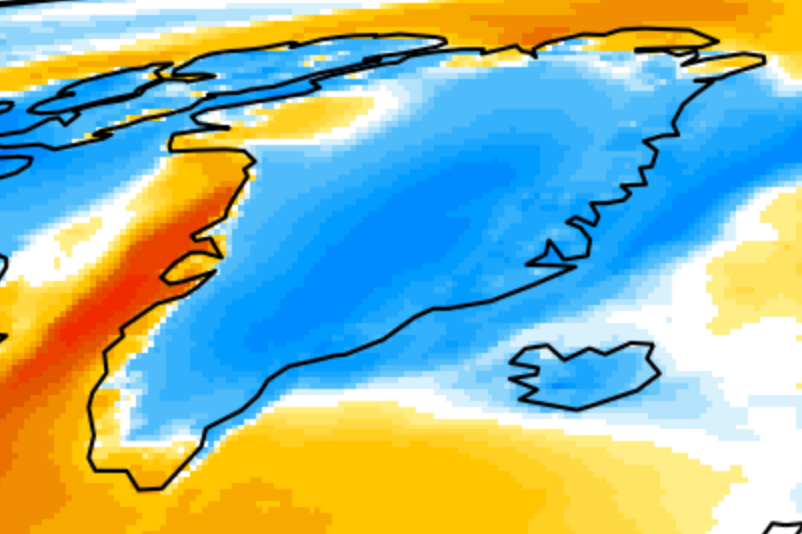
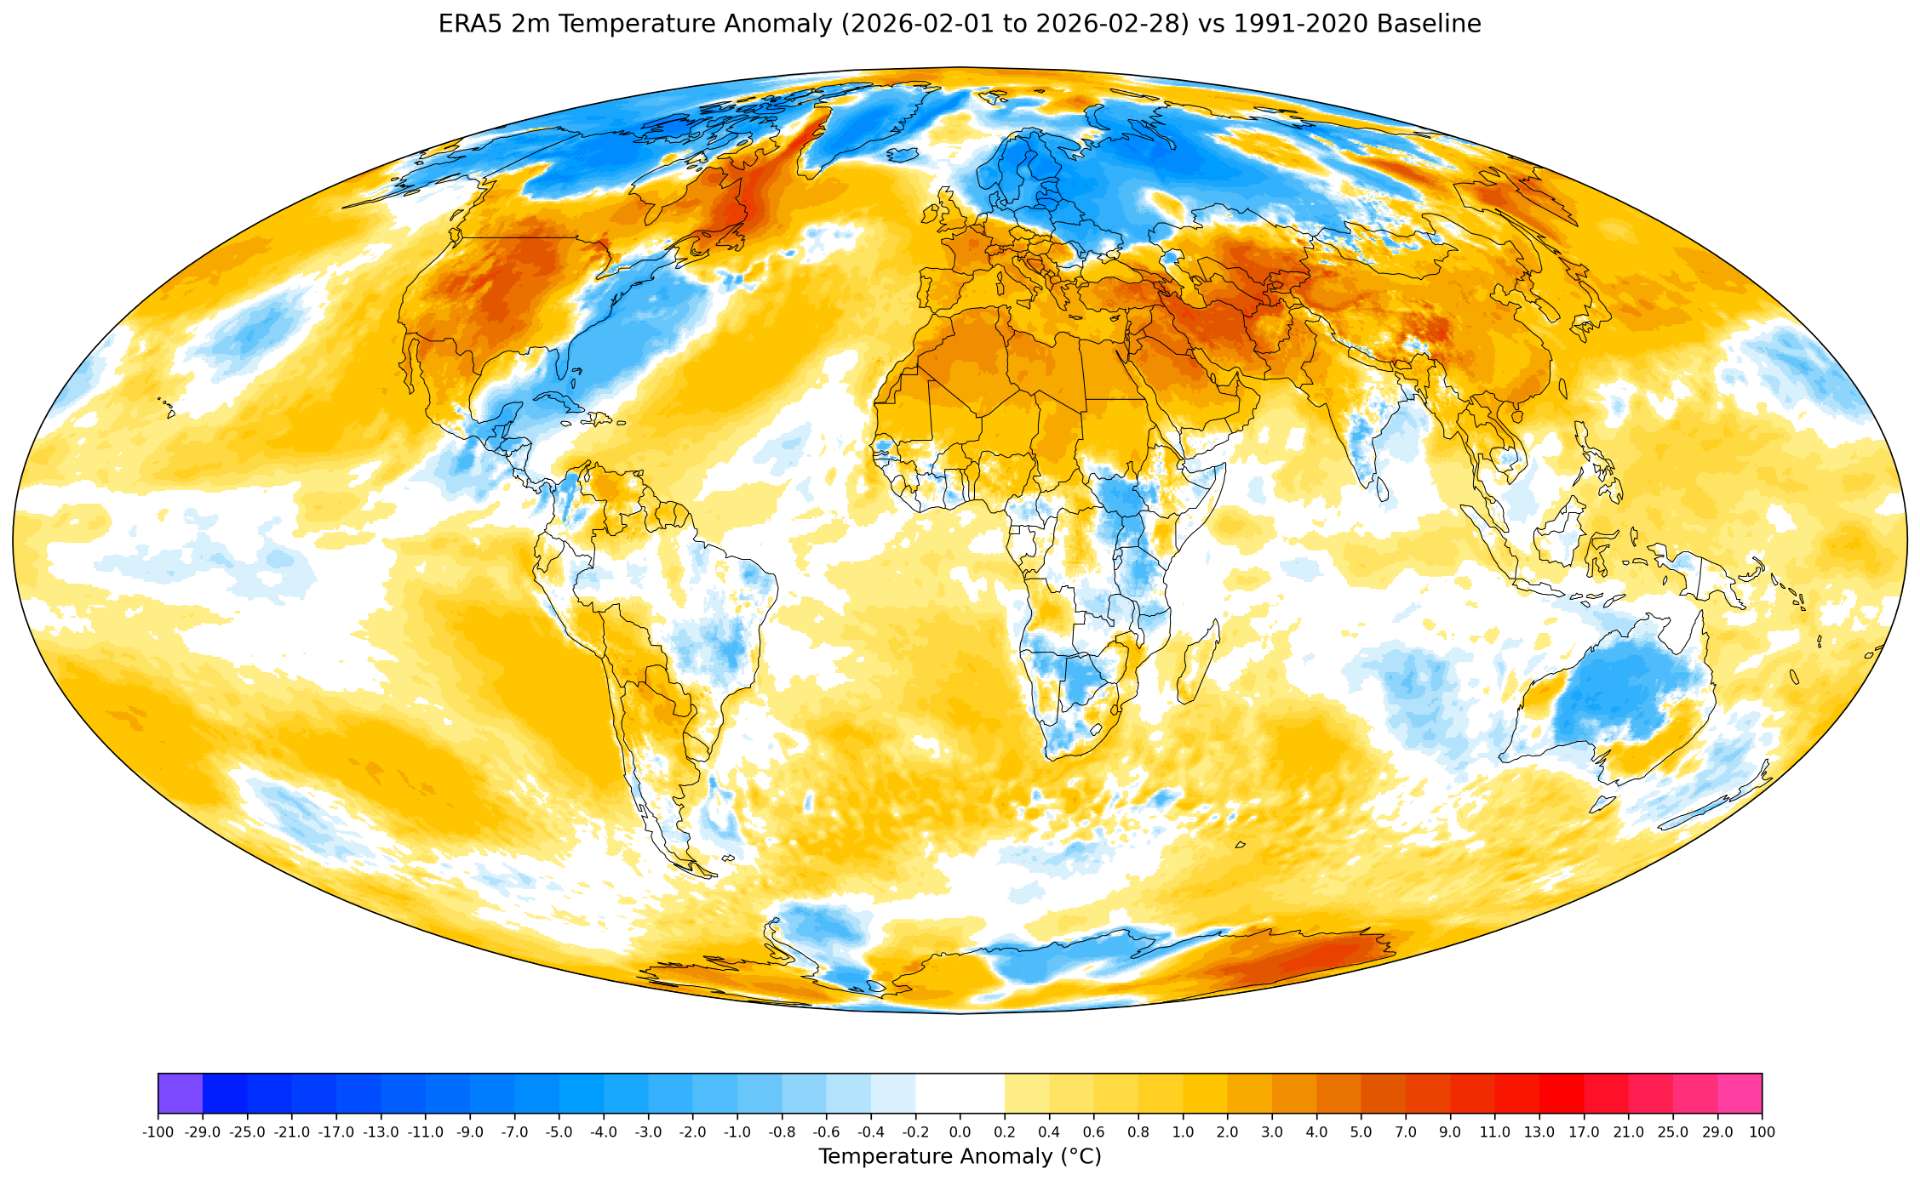
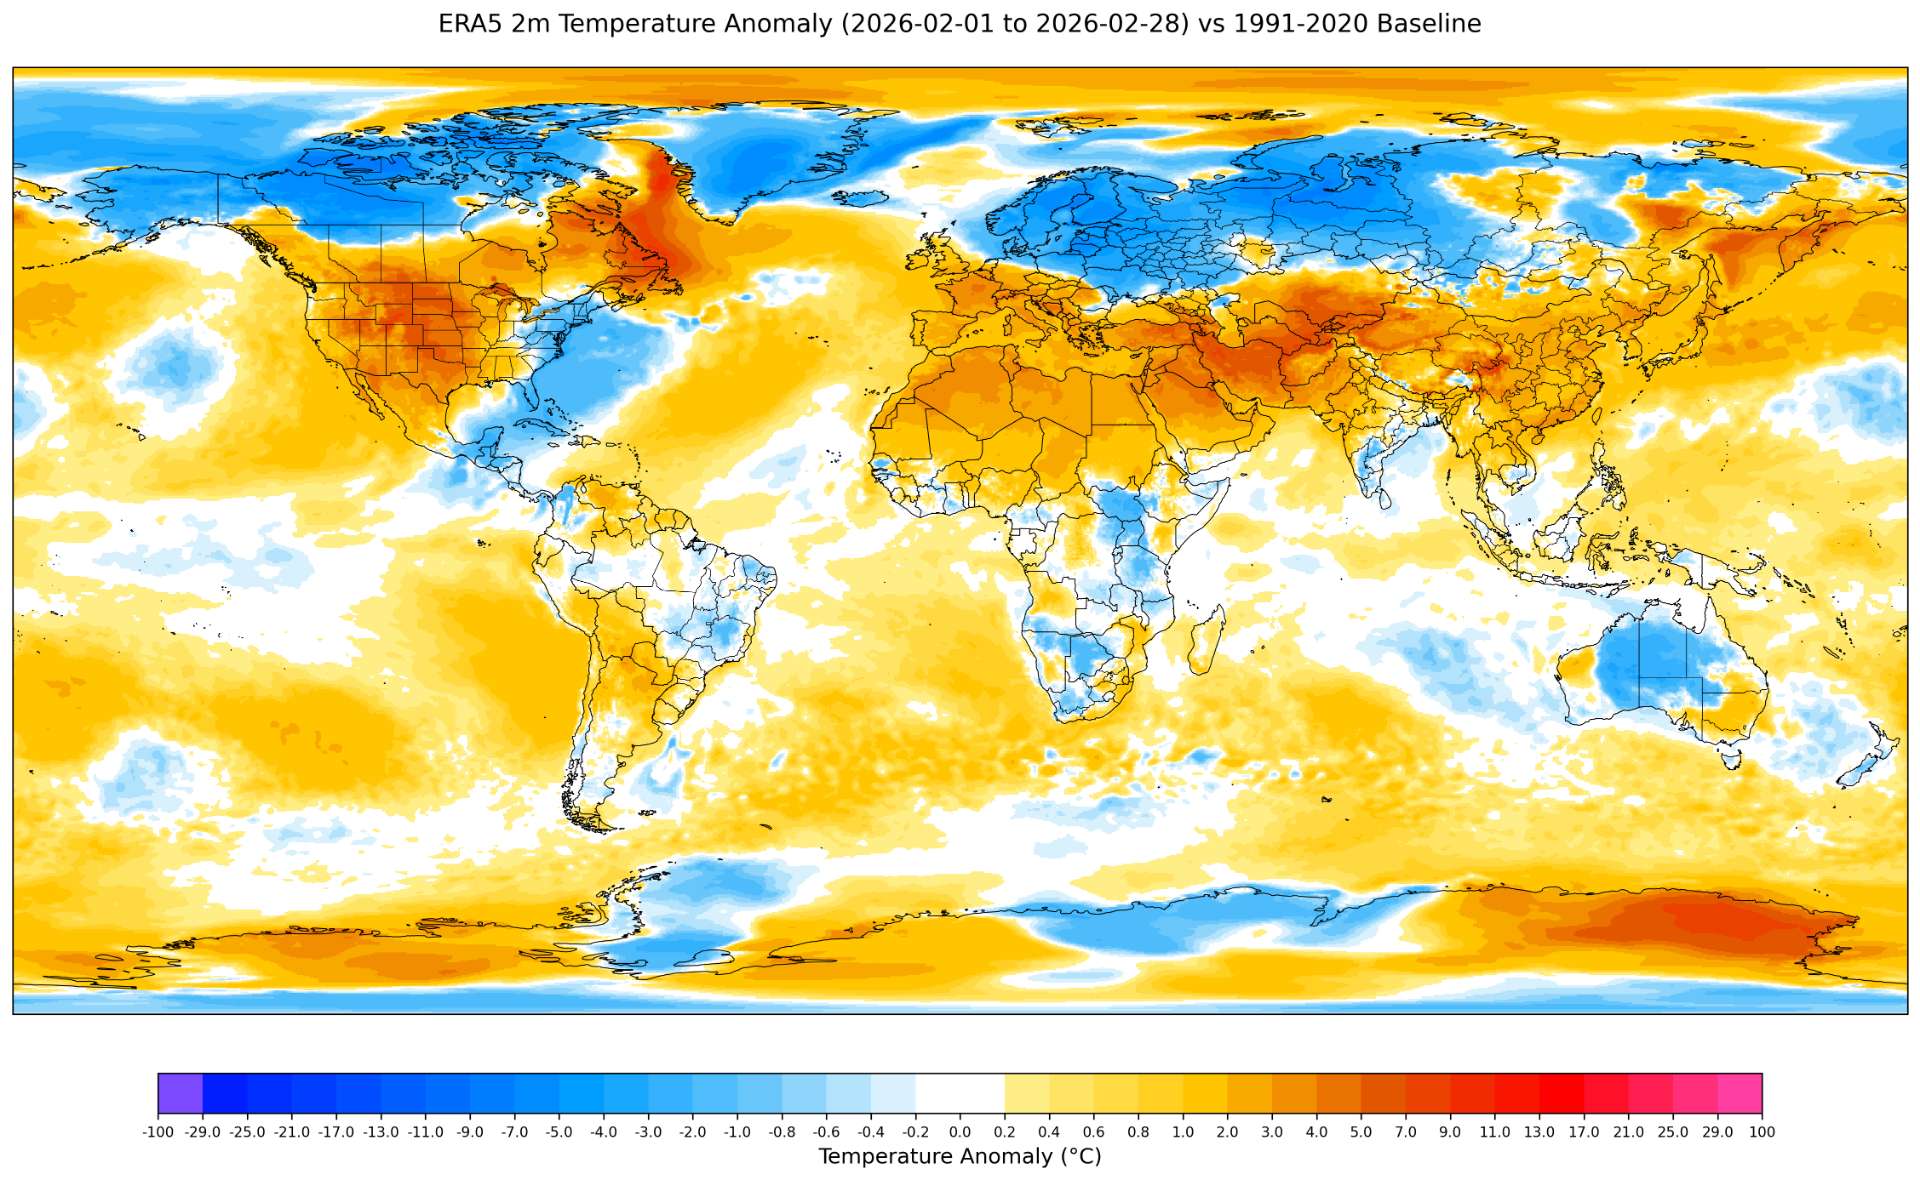
With the erroneously warm Russian stations omitted it looks like NW Russia is being infilled properly. Below is the ERA5 data I reference for the following analysis:
Although NE Canada shows a very warm anomaly in ERA5 that is not the main issue. In the box north of it in GISTEMP covering Greenland and Canada right now it looks like its actually being infilled on the warm side (with the poleward most subbox being infilled by the other hemisphere's islands), so since most of the anomaly will end up being fairly cold in that box, it should have substantial room to shift downwards (if eyeballing the anomaly is ~ -3C, then -3/80 becomes ~ -0.0375 C, and since the box is already on the warm side it could alone cause the global temps to go change by -0.04 or or more). Mexico also looks like its infilled too warm so that should counter some of the missing warm anomaly in NE canada. Rest of NH looks plausible enough as far as what I would expect would be the effect of infilling.
Having taken care of the NH, the SH needs a look to since most of the data is missing.
ERA5 2m temps (through all but last day) below I used as reference. Unfortunately I have to sort of eyeball here without writing more code but it looks like using the air temp as a proxy for ssts, the land anomaly should be cooler than the ocean anomaly this year (Australia is net slightly cold as some of the warm anomalies cancel out perhaps on average by a degree (over say a couple boxes on average) with the surrounding land, and both Africa and the rest of the infilled SE Asia/Oceania being net neutral, and one of the missing boxes from S. America with missing data going to end up neutral rather slightly warm so a change downwards of net about a degree), with the ocean being obviously net warm by perhaps very roughly 1 C. So (-1C*2/80 -1C*1/80 ~= -3/80 C downward adjustment). So based on this very rough and speculative guess, the land anomaly for the SH could drop the global temps by a further -0.0375 deg.
So given the above and below we could see a ~ -0.08 C drop once we get the rest of the data.
Given the starting skewed of gistemp 1.24, this would bring it to 1.16C, which is inline with the original ERA5 predictions.

Since this is very rough guesswork the only thing I am confident in is that the >= 1.25 bins should be safely ruled out now since I've already determined its skewed high and should drop lower. Either this judgment is correct, or polymarket knows something I don't, since they've updated in the last two days (perhaps blindly?) in the other direction. I've also increased my bet slightly in the 1.15-1.20 bin since this estimate is further weak evidence for it.
@parhizj a good chunk of Russian stations have been revised down, at a quick glance there are about 15 remaining
@chaitea Might have missed one yesterday, today there are still 16.
Excluding them I get 124.05 from ghcnm.v4.0.1.20260305.
This was far from my expectations yesterday considering how much coverage there is.
Edit: One thing I missed yesterday looking at the ERA5 map is that the western coast of Greenland had a warm anomaly (it was such a small sliver I missed it).
More stations and better coverage (~12%)
Considering what is there that will bring the temps down in the future:
1) it's very sparse still though in Australia (maybe net another -0.01 C downwards if its a homogenization effect, though Western Australia is still missing which should raise it slightly)
2) Mexico is overdone from US (maybe net another -0.01 C)
3) Looking at the anomalies in the subboxes for NW Russia, despite excluding the hot stations in GISTEMP I suspect the homogenization effect from those erroneously warm stations are still under estimating the cold in the region baked in from the GHCNm run. (this is much harder to estimate but I think at least -0.01 C cooler (-0.02 C more likely) is plausible given the anomalies are in the +9 to +17C range from the 1991-2020 baseline, and given they are supposed to be cold I still think even the nearby "cold" stations that have been updated and included are subsequently higher than they should be -- this is why the cold anomaly has lessened in today's run)
So adjusting from this new data I think -0.04 from the above run, is plausible though it could be more once the Russian stations get removed from the ghcnm run. This would put it at 1.20 C.
I've updated my bets towards this direction but not completely since I am still weighting ERA5 slightly more, since I am less confident than yesterday in eyeballing this.
@chaitea Aye. They didn't remove Narjnan Mar for some reason, but with it in the strange file I also get the same value (124.40).
This is pretty much the worst case for me for the predictions since so many cold stations are missing at the moment (especially in Russia, where they tossed 4 cold stations from the prior run that looked plausibly good).
Australia is still biased warm with a lot of stations still missing. Mexico is still biased warm from the southern US with all of it still missing.
Since NASA is likely to use Sunday night's data and assuming NOAA doesn't fix ghcnm to include Russia in between now and then we are just let with the automatic inclusion of perhaps Mexico and more Australia stations. This outlook doesn't look like enough to drop it down to the 1.15-1.20 bin before the release. I've updated my bets in this direction based on this conclusion with the below analysis:
~
I've updated all my plots this morning so they are much more comparable (all use the ERA5 colormap now) with four very notable changes, that make them not comparable to previous months I've done the charts for them (with the overall effect of better representing what GISTEMP is actually processing for this stage of predictions).
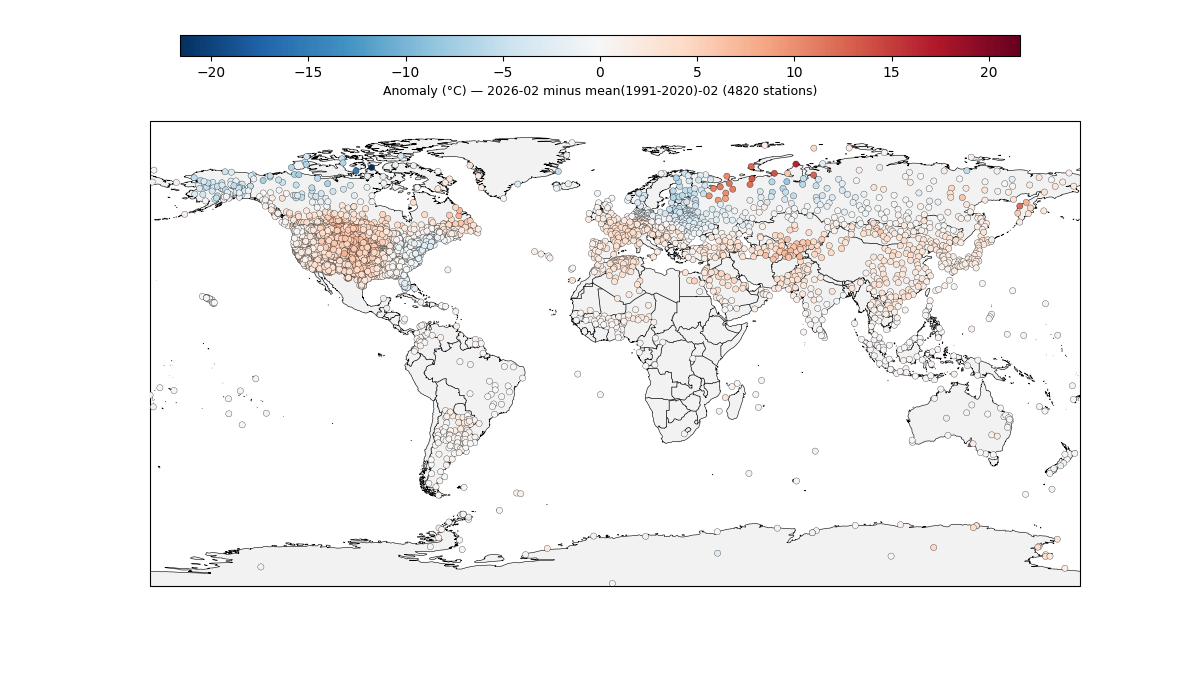
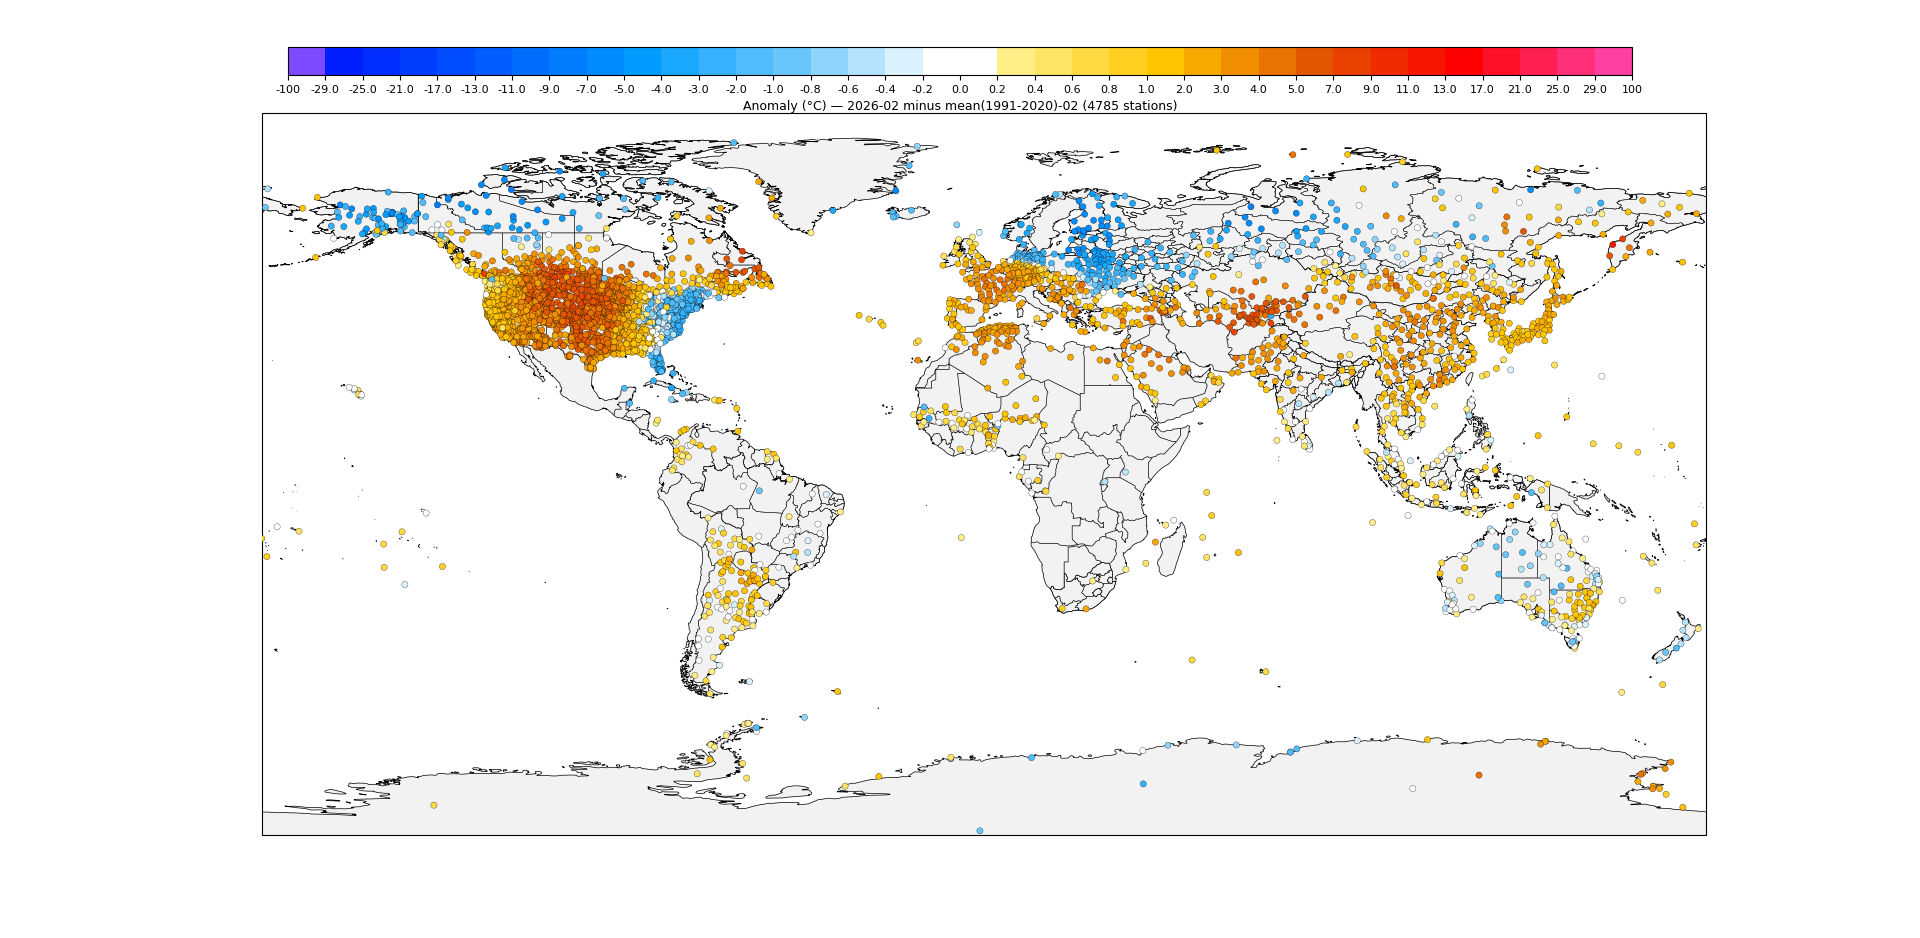
(1) the station plotter now excludes strange stations properly
(2) for the station plotter, I've switched to the min number of years in the 1991-2020 reference period to be included (in order to rebase to 1991-2020 anomaly) in the plot down to 5 years (from 10) since some of the South Africa stations records are still spotty but are obviously being included in GISTEMP with its compositor.
The anomaly averages won't be as good, but it increased the number of stations plotted from 5046 to 5331 for the latest run before applying (2). After applying (3) it went down to (edit v2) 4785 though.
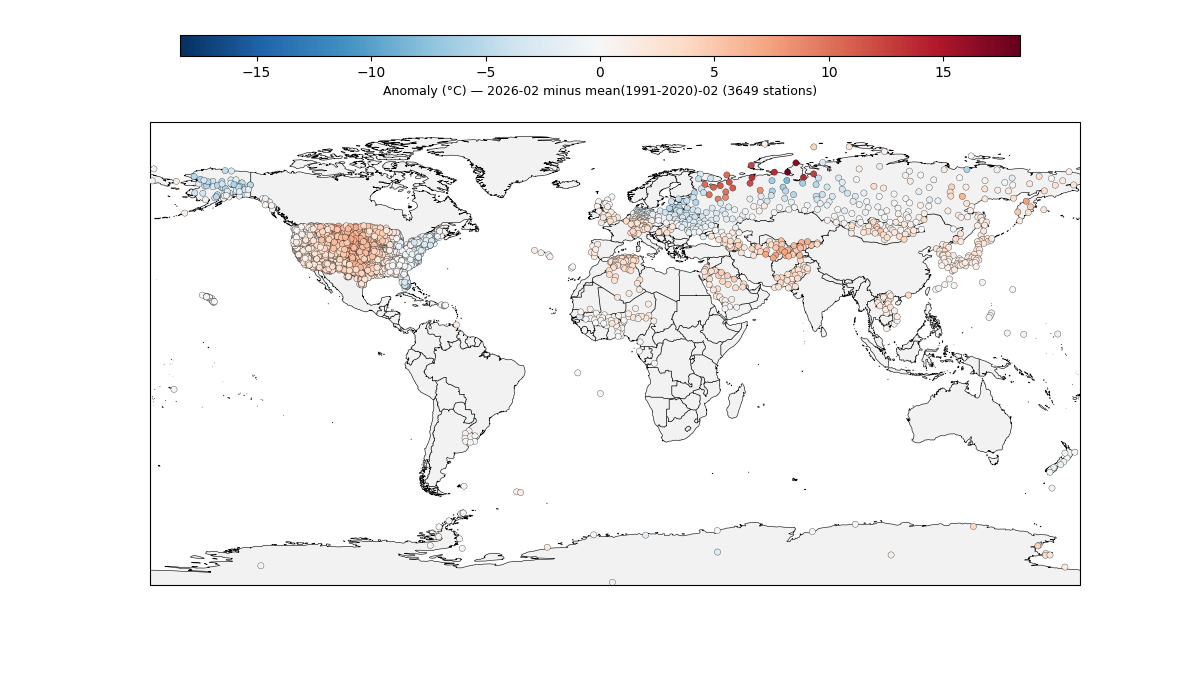
(3) the station plotter also now excludes stations that are masked for a particular month (step3 + step5mask); i.e. SF001485170 is masked for February, which is giving South Africa an overall warm anomaly in GISTEMP with the current data available.
(4) the land subbox comparison also now excludes subbox that are ocean subboxes (using step5mask file); this lumps any "missing" with it (also needed to change colors for the legend for missing, only in reference difference). This means the coverage percent will be based on the LAND coverage (%) of land subboxes.
So now the first two charts below can be used to discern the differences between the datasets, and the last understand why the difference is present (what stations are absent, erroneous or different).
ERA5 (t2m) in plate carree for reference:
ghcnm.v4.0.1.20260306:
above without step 3 and step 5 gistemp filtering (change (3) above):

Edit v2:
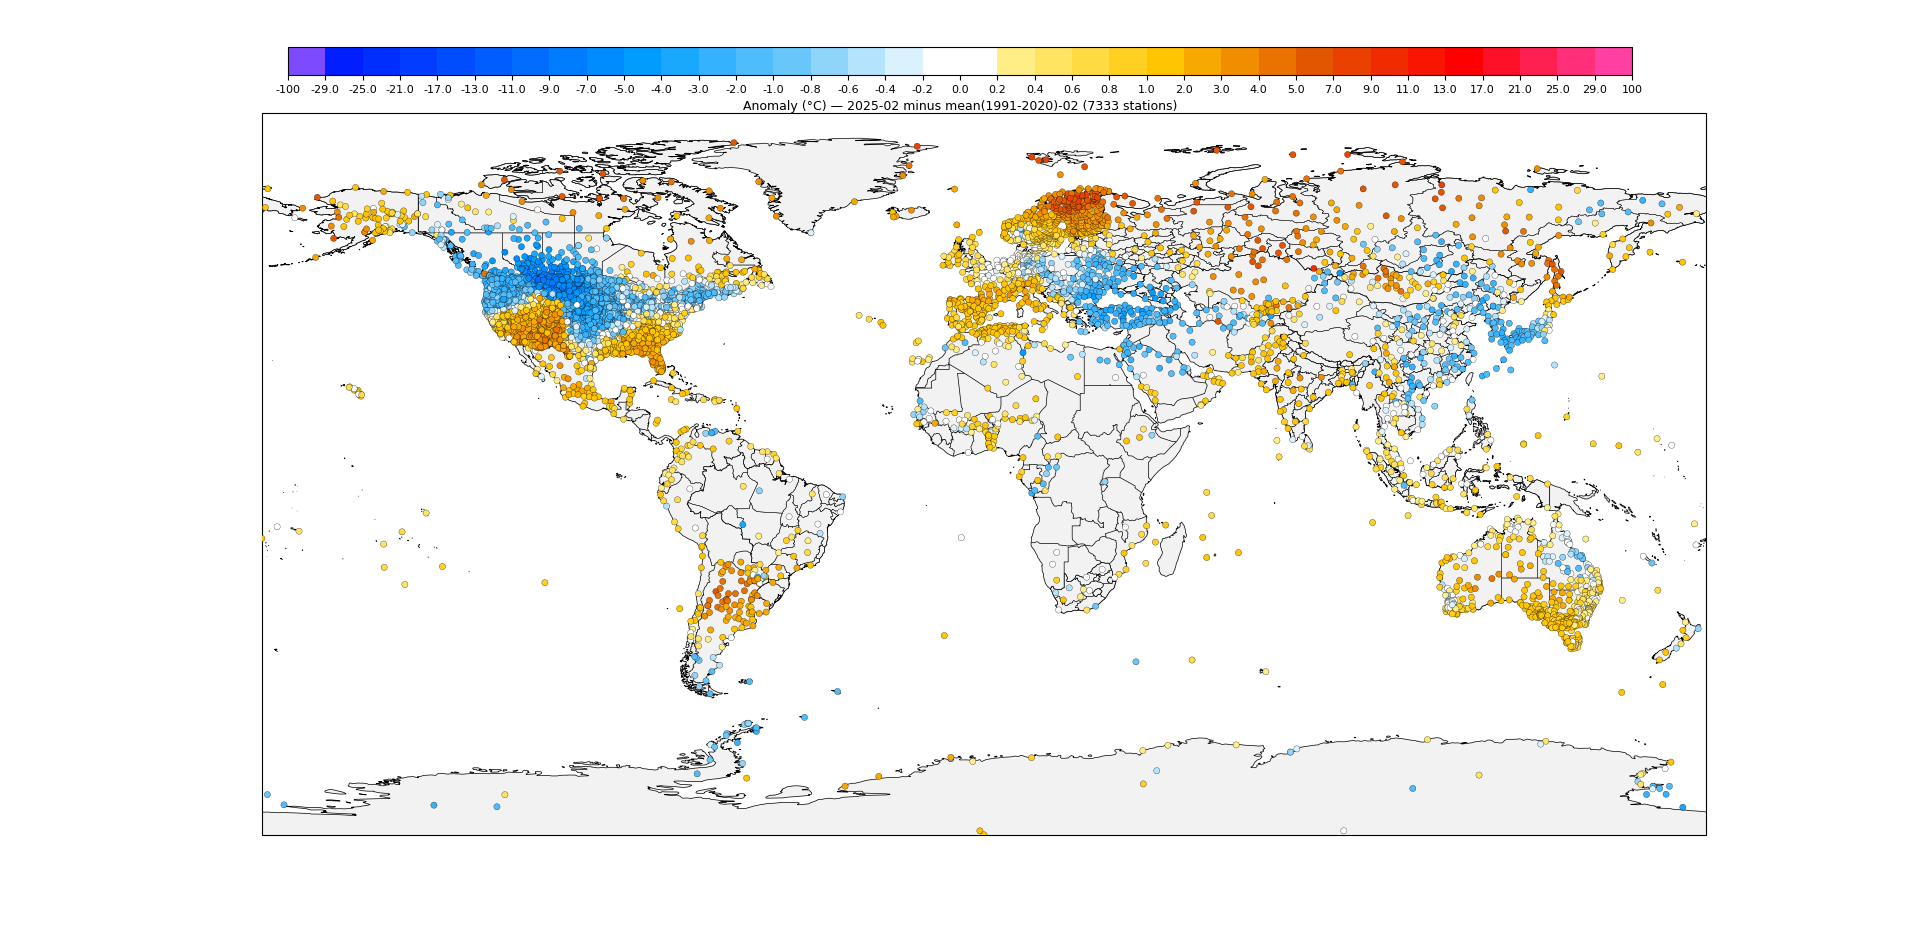
Here is what Feb 2025 looks like for comparison (7333 stations, so only 65% the number of stations in latest run).
@Rhhgdd these are raw figures without adjustment. GISS was normally +0.015 in the last 3 months of 2025 compared to my model.
In January we've had a lot more coverage and the normally anomalous South Africa stations haven't come in and the giss-model diff was -0.013.
Even if the hot SF stations come in for February they won't have that big of an impact as after all we're expecting a lot more stations upon release. So for the time being, I'm expecting 1.180-1.198 as the range, we'll see how the forecast changes over the next few days but all ensembles have started aligning now so I'm expecting little divergence.
edit://decimal point mistake
@Rhhgdd I'm fairly sure you meant to write +0.015 and -0.013 (I've made that mistake myself a couple times). Here is my own GISTEMP->ERA5 errors (i.e. what I call the unadjusted number around the 2nd/3rd of the month): note though that for March 2025 onwards I use my own gistemp run's unrounded data, using the ghcnm run's data used for the official release to calculate the error, with the notable exception of August and September 2025 when I think the coverage was fairly poor.
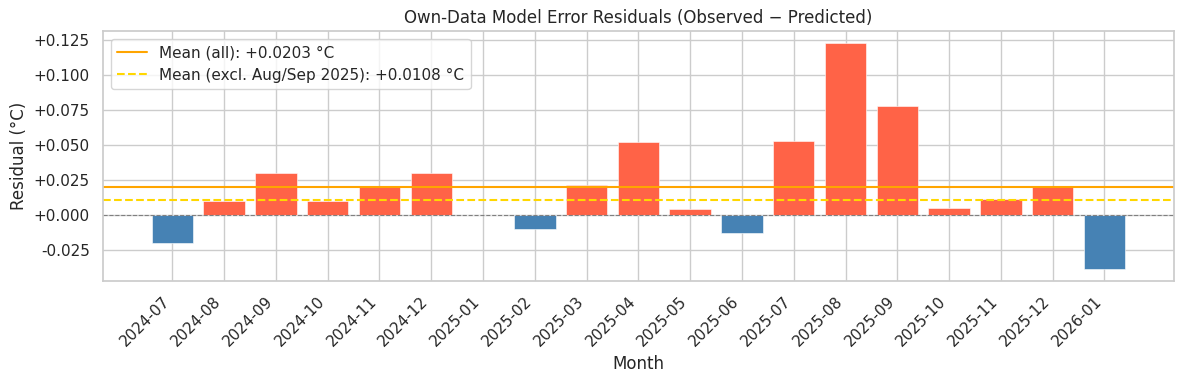
For reference though, I stuck with a final bias adjustment of +0.014 from August 2025 onwards given the above concerns. For this month I am going to stick with a subjective adjustment as I mentioned though (for now, -0.005 C).
~
You said, "after all we're expecting a lot more stations upon release" but in terms of absolute number of stations I really do not think this will be the case as based on the shift in ghcnm that happened (some time around) after February 2nd (and continues until now) -- if the current practice continues we will have GREATER coverage but LESS stations.
With that in mind I don't think the August-Dec 2025 runs on will be the best comparison in terms of coverage when early runs come out; you can look at the numbers now though to see that Oct-Dec 2025 actually has less stations in the most recent ghcnm data than from runs weeks after the GISTEMP release date (about 500 less stations) (this is why I'm still using my gistemp run with the ghcnm from February 2nd for the overall historical statistics in my ERA5->GISTEMP model).
For example, taking a common release for the Oct-Dec LOTI (i.e. ghcnm nightly releases dated from 20251107, 20251207, 20260107) we had ~6700-6800 usable stations (by some ad hoc way I check it: ghcnm stations >=10 years in the 1991-2020 baseline period) available for that 8th day of the month. By comparison, for January (the ghcnm release dated 20260207) had 5450 stations (and even last night's ghcnm only had 5969).
@parhizj My model doesn't utilize ERA average temps, I find it way too inaccurate. But if i know which stations will be available upon release I am pretty accurate, the more the stations the smaller the error too.
The only thing that's just been catching me off guard these last few months is how unreliable GHCNm is when it comes to data availability. In this day and age it really shouldn't be that difficult to just maintain stability when other reanalysis tools are able to do so.
Generally we have an increasing trend in the number of stations. And some of the data came in a lot earlier in February for Jan. however, I haven't actually looked into "usable stations"
@Rhhgdd That's fine if you don't use ERA5, but if you use something better though I'm pretty sure your error wasn't THAT large for the last 3 months ... (an error of 0.15 is 3 bins -- of course my error was also very abnormally large for August/October but those were exceptional -- and the monthly model for August has poor correlation); I checked your posts for January for instance and the last one I think you posted 1.1 or 1.11 so thats only a -0.02 or -0.03C error
@parhizj oh yeah I editted that, I meant 0.015 ofc 😅 I got 1.087 raw then adjusted up to 1.1-1.11 as that's what the adjustment was in winter 2025.
And then January came along, the stations available on the 11th were completely different and the highly anomalous South African stations haven't come in at all.
Ultimately, I don't even know what to expect for this month until GHCNm data comes out more consistently. It's guesswork this month but I'm expecting either -0.015 lower or +0.05 higher.
Unless of course South African 100°C stations come in then we're looking at the higher end. On the other hand with more coverage as you've previously mentioned, they won't make as big of a difference.
@chaitea Model unadjusted: 18/2 - 1.176.
And because we don't know whether to adjust up or down yet current range is 1.16-1.19 which is not ideal and not very accurate... If it is anything like January coverage then we are adjusting down so my money is on the lower range, subject to forecast change but it's stabilizing rn
@chaitea Model unadjusted: 19/2 - 1.176
Interesting to see the same exact results, toss of a dice anyway
@chaitea 21/1 - 1.179,
I think safe to say this should be adjusted downwards after doing some station reconnaissance
@chaitea A small rise in your data? Mine has trended marginally downwards for the last several days....
@parhizj looks like a subtle change in NH, the temperature drop isn't as severe so some subboxes are expected to be warmer. this could just be due to a forecast overcompensating so i normally look at the average of the last few days from my model rather than a single daily value
my final adjustment will be -0.008. still expecting 1.16-1.17
@chaitea 👀 Well if warmer ssts have buffered all that cool air in the North I could I understand since I only track 2m air temp if thats the reason its been diverging a good deal from my unadjusted temp since the dip.
@parhizj 27/2 - 1.189 (adj 1.18)
the increase was a small bleep, but like i said before looking at average, expecting 1.17-1.18